Moving from Graphite to InfluxDB
For some time we have been collecting metrics using Statsd, feeding them into Graphite and alerting on them via Nagios. However, as we noted when we set this up, there are some drawbacks to this configuration. Graphite has a rather opaque configuration which is prone to errors which can lead to data loss. In fact, we noticed that some metrics we were collecting in Graphite did not seem to be accurate, despite the fact that our configuration appeared to be correct.
Furthermore, querying Graphite is notoriously difficult and our system of raising alerts by querying Graphite using Nagios scripts left something to be desired in terms of user-friendliness and flexibility.
Enter InfluxDB
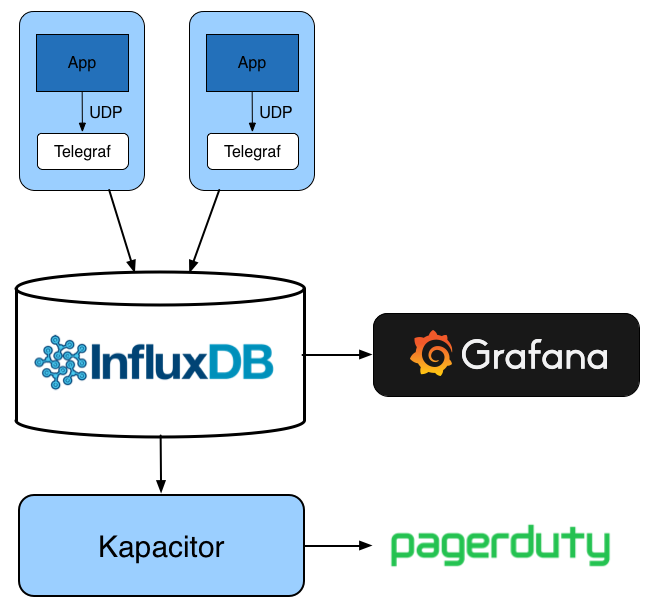
Our new metrics architecture with Telegraf and InfluxDB
InfluxDB is an open source time series database which is much easier to set up than Graphite and has the advantage of a nice SQL-like query language which can be used to explore your metrics easily. InfluxDB is part of the TICK stack which consists of four components:
- Telegraf – an agent for collecting metrics from a variety of inputs and forwarding them on to InfluxDB
- InfluxDB – the time series database
- Chronograf – a simple web application for building graphs and dashboards from InfluxDB data
- Kapacitor – an alerting and data processing engine which processes data from InfluxDB and can perform operations on it or trigger events
After evaluating Chronograf we decided that it was not as feature-rich as Grafana, which we were already familiar with and which has the advantage of being open source. So we decided to stick with Grafana for our graphing and dashboarding needs.
Configuring Telegraf
Telegraf turned out to be a very useful part of the stack in that it can be configured with a very wide range of input and output plugins. We used the Statsd plugin to enable Telegraf to function as a drop-in replacement for the Statsd daemon on our servers. No changes were required to the applications themselves, they just continue sending metrics using the statsd protocol on the same UDP port as before. We configured Telegraf using a Chef cookbook and the Statsd plugin configuration is as follows:
[inputs.statsd]
allowed_pending_messages = 10000
delete_counters = true
delete_gauges = false
delete_sets = false
delete_timings = true
metric_separator = "."
percentile_limit = 1000
percentiles = [90]
service_address = ":8125"
udp_packet_size = 1500
We made some changes to the defaults to enable Telegraf to behave more like the Statsd daemon. Firstly we set delete_counters to true, this means that counters are reset to 0 at each collection interval, which by default is 10 seconds. This leads to entries in the InfluxDB database showing the count in each 10 second interval, rather than an ever-increasing cumulative value. We also set the metric_separator to a dot. By default, Telegraf will replace the dot separators in statsd metrics with an underscore. This is easier to query in InfluxDB, but we found that keeping dots plays nicer with Grafana, which has a function to split measurement names on dots to construct labels for graphs.
Testing and Querying
To check that our stack works as expected, we can send some statsd metrics on the command line and query InfluxDB to see that the measurements are there. Statsd metrics can be easily sent using nc:
$ echo "mycounter:10|c" | nc -C -w 1 -u localhost 8125
$ echo "mycounter:1|c" | nc -C -w 1 -u localhost 8125
$ echo "mycounter:1|c" | nc -C -w 1 -u localhost 8125
$ echo "mycounter:3|c" | nc -C -w 1 -u localhost 8125
The general format of a statsd protocol message is <metric name>:<value>|<type>, so in this case we are incrementing a counter called “mycounter”.
We can then query InfluxDB on the command line:
$ influx -database telegraf
Visit https://enterprise.influxdata.com to register for updates, InfluxDB server management, and monitoring.
Connected to http://localhost:8086 version 0.12.1
InfluxDB shell 0.12.1
> precision rfc3339
> select * from mycounter
name: mycounter
---------------
time			host		metric_type	value
2016-06-21T14:20:18Z	influxdb	counter		10
2016-06-21T14:20:58Z	influxdb	counter		1
2016-06-21T14:21:28Z	influxdb	counter		1
2016-06-21T14:21:38Z	influxdb	counter		3
We can also perform aggregate functions on the data, for example to sum all the values:
> select sum(value) from mycounter
name: mycounter
---------------
time			sum
1970-01-01T00:00:00Z	15
More information about the InfluxQL query language is available in the documentation.
Alerting with Kapacitor
Previously, we ran scripts using Nagios which queried Graphite and would raise an alert based on simple conditions, such as a value being over a threshold. Since moving to InfluxDB, we have started using Kapacitor to raise alerts from the time series data. Kapacitor uses a scripting language called TICKscript which has quite a steep learning curve, but allows events to be raised on any kind of criteria, for example we can say that a value must exceed a threshold for a certain period of time and that it must be rising. Kapacitor is not limited to raising alerts, but is a general purpose data processing engine which can perform all kinds of operations on time series data.
The following is one of our TICKscripts, which compares the number of errors on our Booking Service with the number of successful requests, and raises an alert to PagerDuty if the ratio is above a certain value:
var requests = batch
    .query('SELECT sum(value) FROM "telegraf"."default"."shutl.booking_service.status_code_ok"')
        .period(5m)
        .every(10s)
        .fill(0)
var errors = batch
    .query('SELECT sum(value) FROM "telegraf"."default"."shutl.booking_service.status_code_error"')
        .period(5m)
        .every(10s)
        .fill(0)
var error_rate = requests.join(errors)
          .as('requests', 'errors').tolerance(10s)
error_rate.alert()
        .id('booking_service_request_alert')
        .message('Booking Service errors = {{index .Fields "errors.sum" | printf "%0.3f"}} requests = {{index .Fields "requests.sum" | printf "%0.3f"}}')
        .crit(lambda: ("errors.sum"/"requests.sum")>0.1)
        .pagerDuty()
The pagerDuty function is built into Kapacitor, and configured in the kapacitor.conf file. Needless to say, we also used a Chef cookbook to configure Kapacitor.
Pros and Cons
Overall we have been very happy with InfluxDB and don’t miss Graphite at all. Alerting directly to PagerDuty from Kapacitor is much nicer than using custom Nagios checks although it did take us a while to get to grips with the TICKscript syntax and debugging is not easy. Graphing the data in Grafana is very easy after using the InfluxDB command line to explore the data and refine the necessary queries. Now we just need to start feeding more metrics into the system…